Stripe Payments

Senior Ux/Ui

Headquarters

South San Francisco

Founded

Founded

1864

Industry

Industry

Drinks and Beer

Revenue

Revenue

US$ 91,5 bilhões

Company size

Company size

7,000+

Challenge

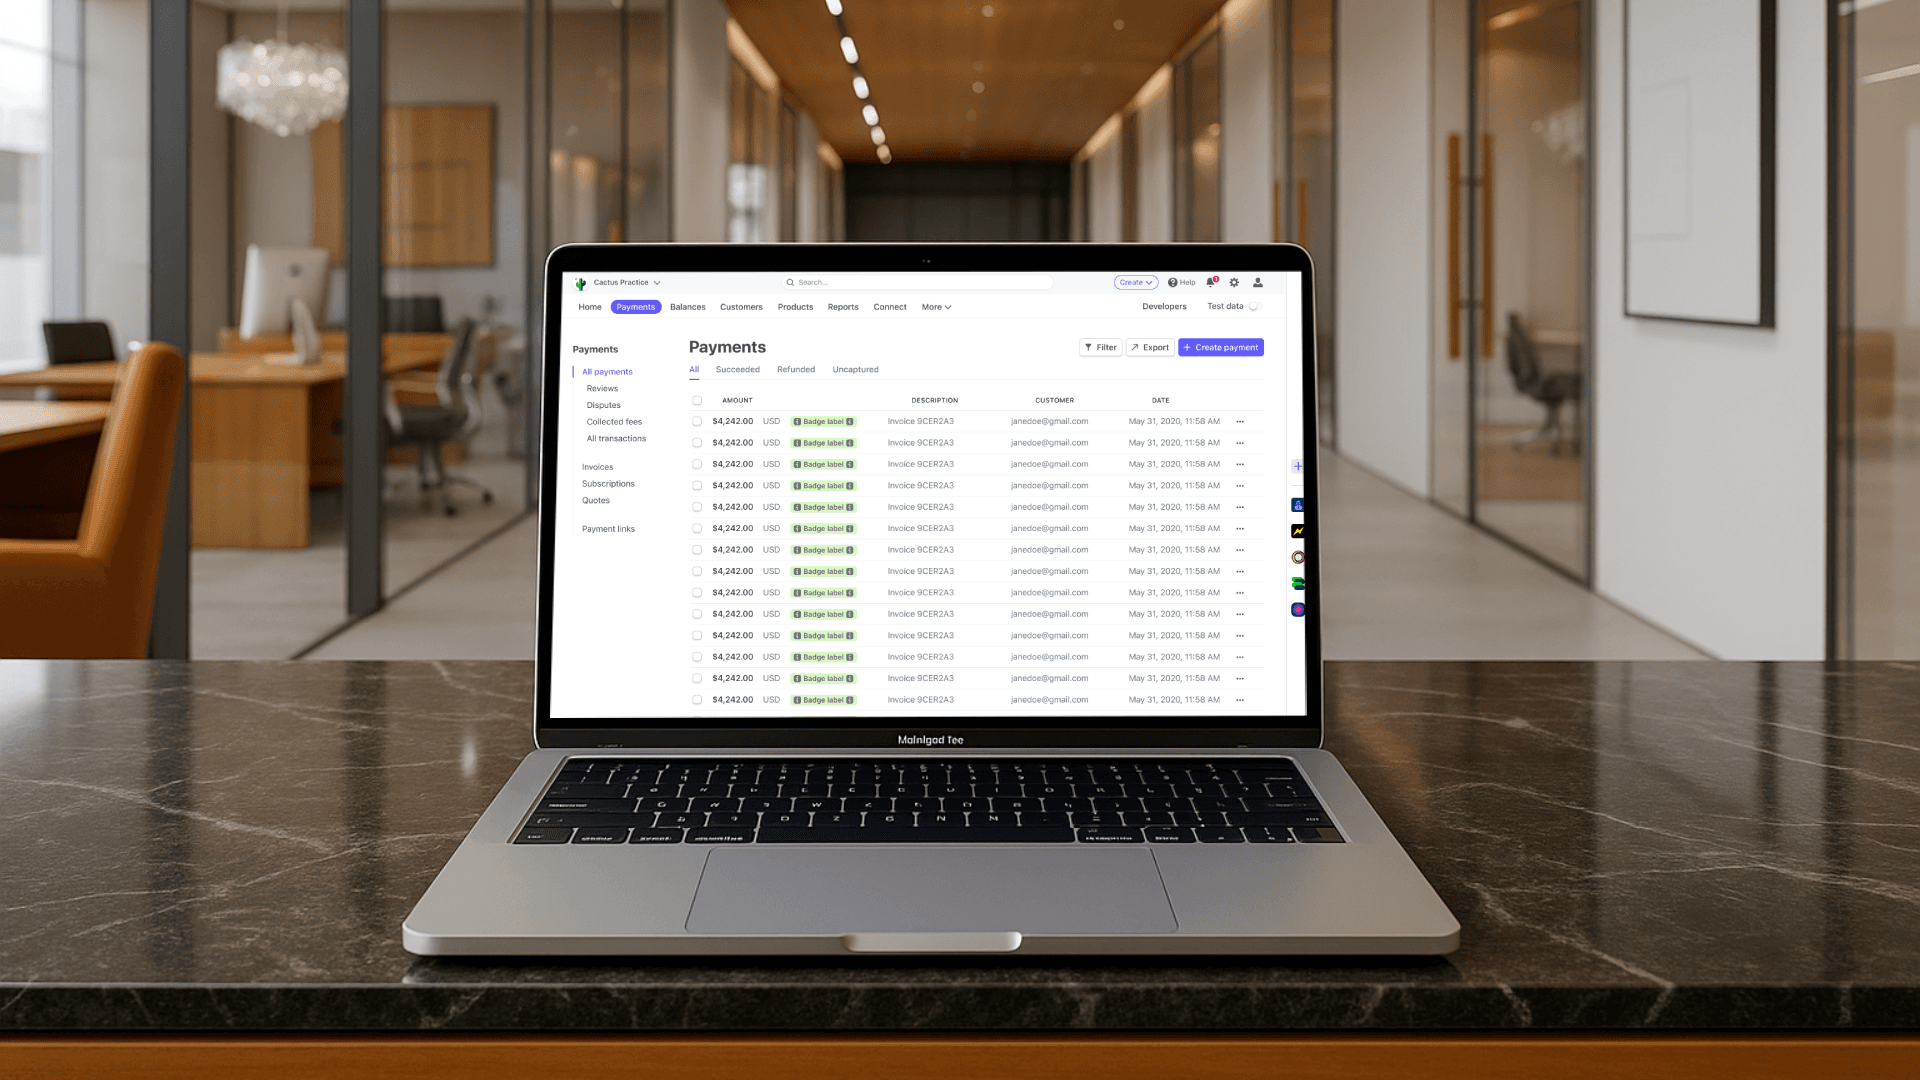
When I joined the Stripe team to work on the Merchant Dashboard experience, the main challenge was the complexity of the interface, which was overwhelming for small businesses and not aligned with Stripe’s core values of simplicity and developer-friendliness.


To address this, we conducted in-depth research and usage analysis to identify the most critical pain points — focusing on the screens with the highest drop-off rates and the most frequent support tickets. Our goal was to simplify the experience without sacrificing the powerful functionality Stripe is known for.

Results

Post-redesign, the Stripe dashboard saw a 28% reduction in time-to-first-transaction and a 35% drop in integration-related support tickets.

User satisfaction scores increased from 3.5 to 4.7, reflecting the improved clarity and responsiveness of the new interface.


The streamlined onboarding flow and redesigned API documentation contributed to a 22% uplift in developer activation rates and a 19% increase in new account signups within the first quarter after launch.

Research Process

Google analytics, Lyssna, Maze & hotjar

Research & Analysis: We conducted interviews with merchants and developers, sent out targeted surveys, and analyzed product usage data to identify friction points in the payment integration experience. We also benchmarked leading fintech solutions and studied industry best practices to gather strategic insights.


Information Architecture: Guided by our findings, we restructured the dashboard layout and content hierarchy, prioritizing access to transaction data, payout timelines, and API tools — aligning the flow with real user needs across different business models.


Wireframing & Prototyping: We created low-fidelity wireframes to map the user journey from setup to live transactions. These were tested and refined through collaborative sessions with users. High-fidelity, interactive prototypes were then developed to simulate real-world usage scenarios across web and mobile.


Usability Testing: We ran moderated usability tests with a diverse pool of Stripe users — from startups to enterprise clients — to validate task flows, identify confusion points, and measure efficiency. Feedback loops helped us iterate quickly and confidently.


Visual Design & Style Guide: We refined the visual identity by incorporating Stripe’s brand elements with a focus on clarity, accessibility, and scalability. A comprehensive UI kit and design system documentation were delivered to ensure consistency across teams and future product evolutions.

Research & Analysis: We conducted user interviews, surveys, and analyzed in-app analytics to understand the pain points and user needs. We also studied competitor apps and industry trends to gather insights


Information Architecture: Based on the research findings, we restructured the app's navigation and content, prioritizing features and information according to user needs.


Wireframing & Prototyping: We designed low-fidelity wireframes to visualize the new layout and navigation, iteratively refining them based on user feedback. Afterward, we built a high-fidelity, interactive prototype to test the design.


Usability Testing: We conducted usability tests with a diverse group of users to validate the design and identify areas for improvement. Based on the feedback, we made necessary adjustments to the design.


Visual Design & Style Guide: We developed a cohesive visual language, including color schemes, typography, and iconography, ensuring consistency throughout the app. We also created a style guide to maintain design consistency in future updates.

10k+

People Interviewd

60%

Increase on revenue

52%

Increase in time spent on the app.

Ux/Ui - Results

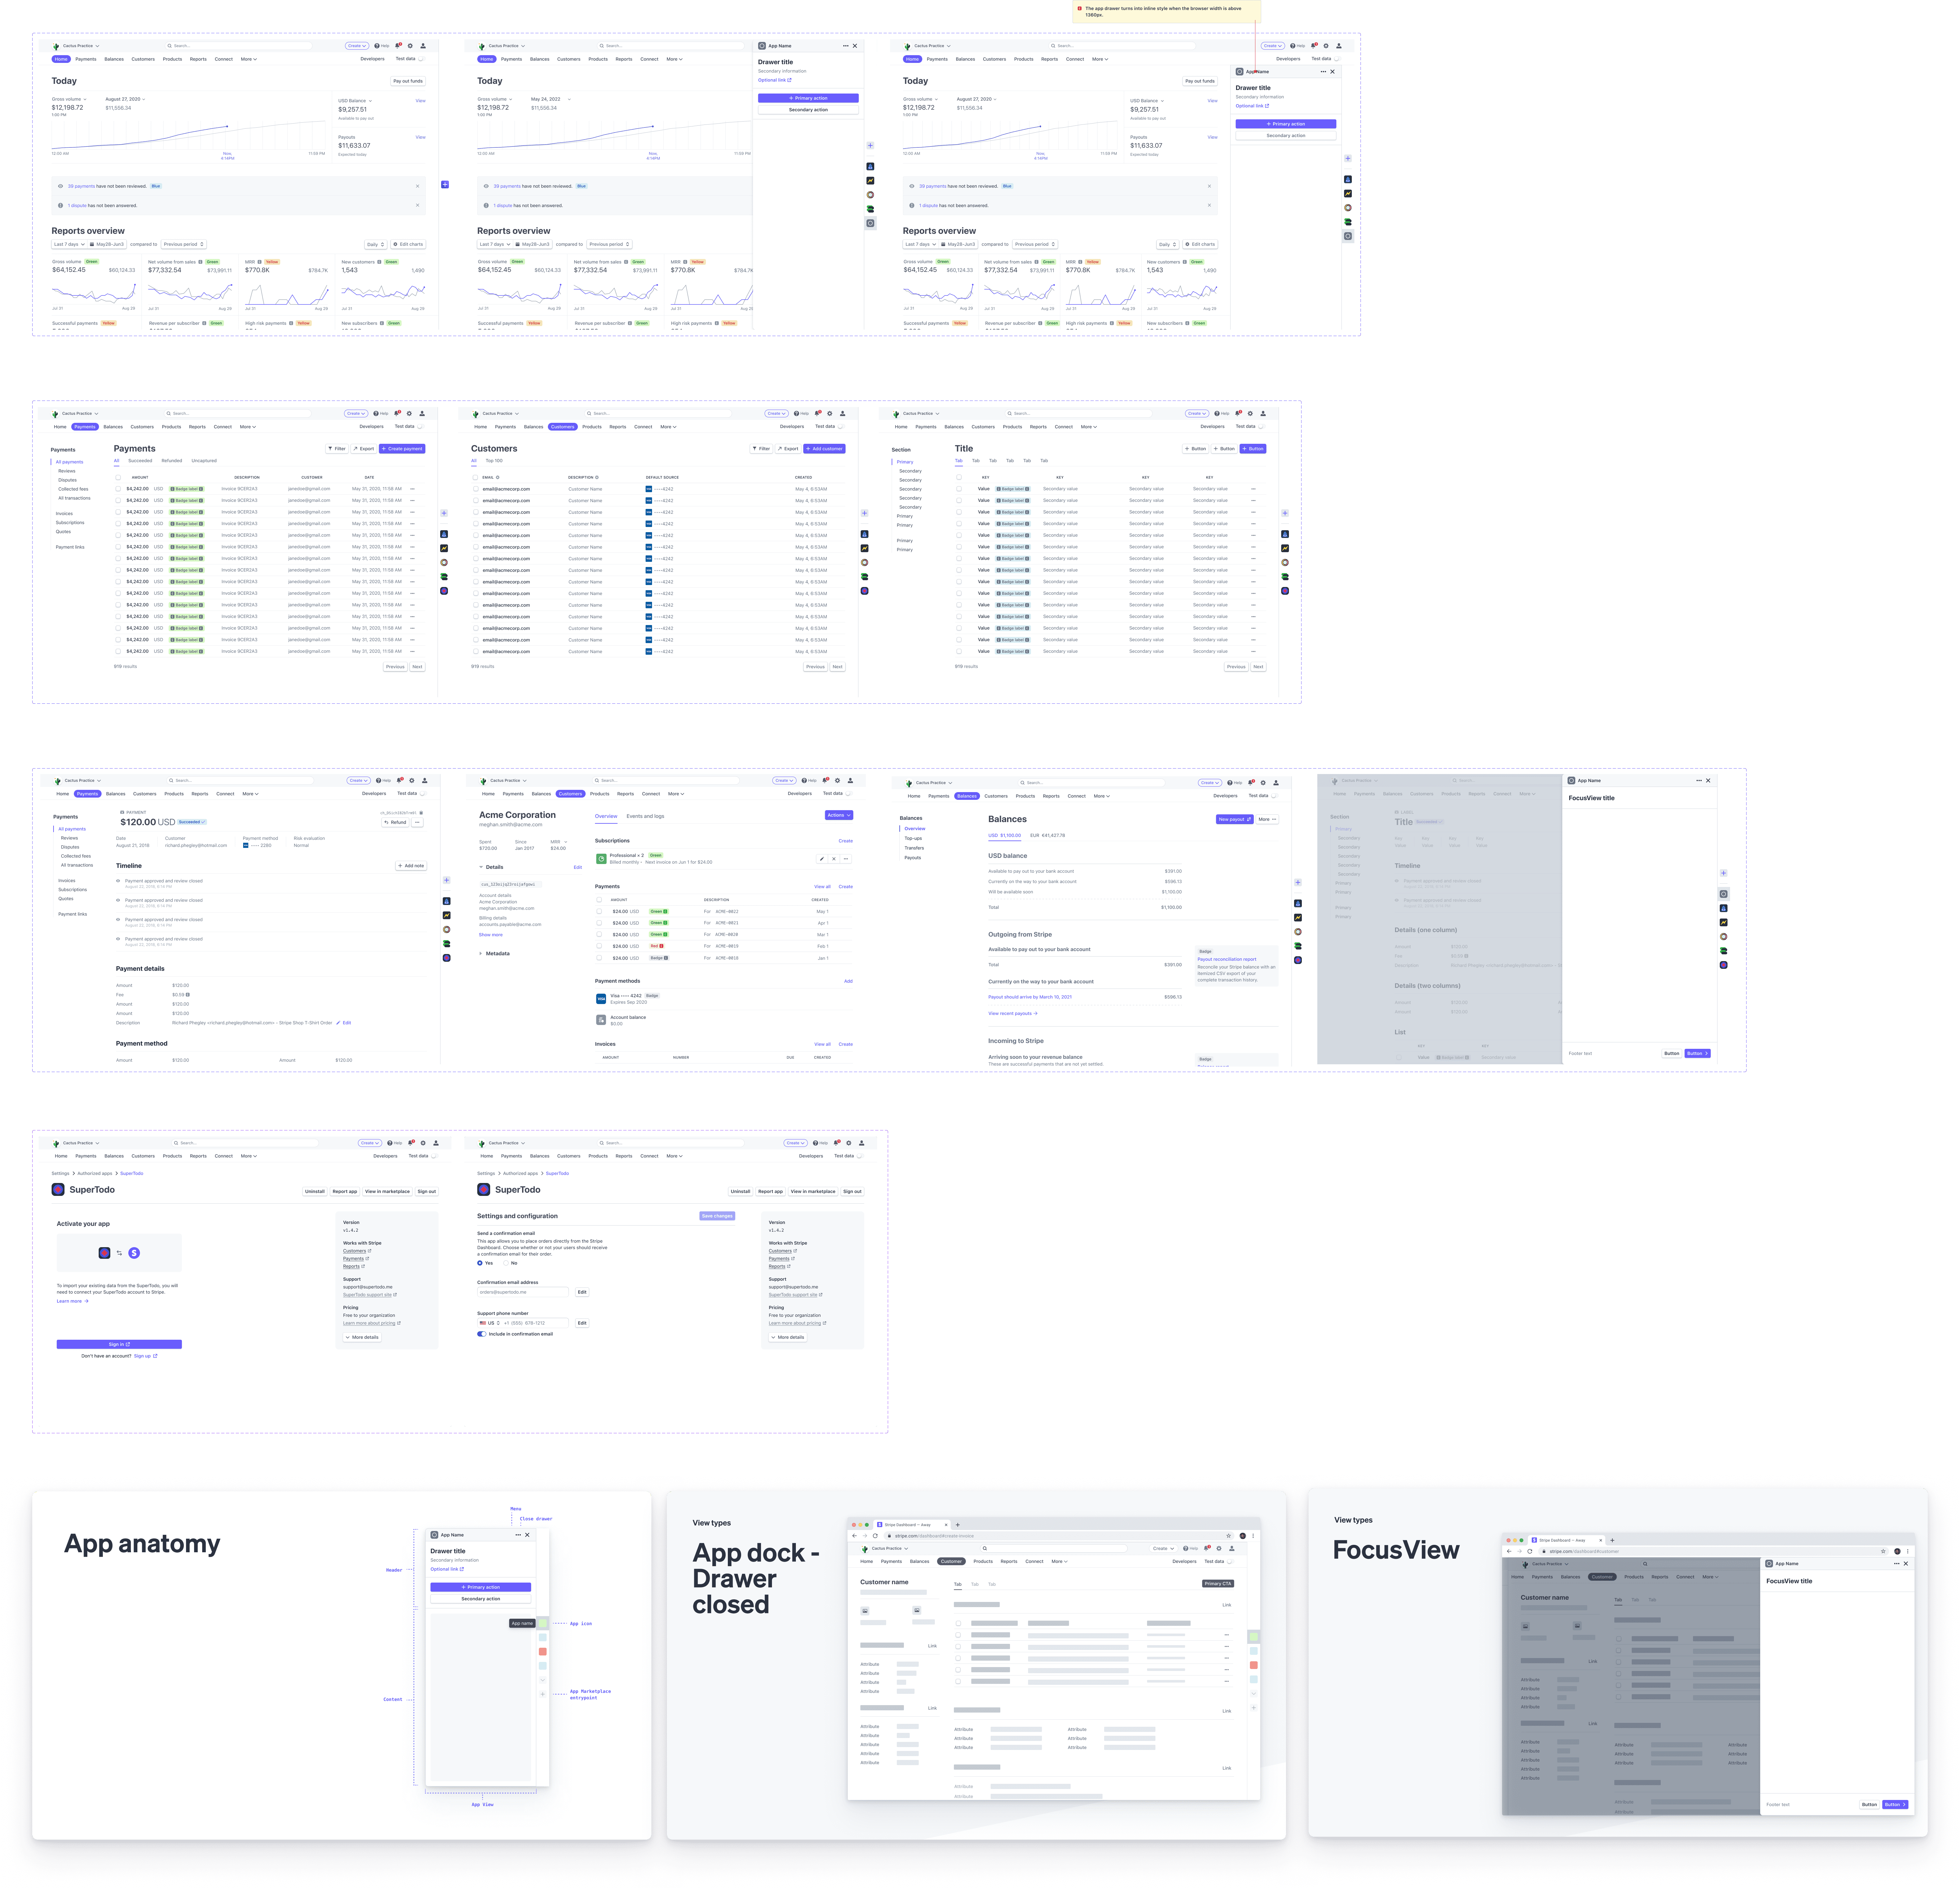
After carefully conducting research and ensuring that users want to, we decided to implement a new features that enhances user experience and addresses their specific needs. This features will not only streamline interactions but also foster greater engagement and satisfaction within our platform.

User Flows

Stack

Stack

Stack

"The redesign not only modernized the visual language, but also aligned the product experience with Stripe’s mission to increase the GDP of the internet — delivering a cleaner, more intuitive, and scalable platform for businesses of all sizes."

Emily Parker

Product Coordinator

Conclusion

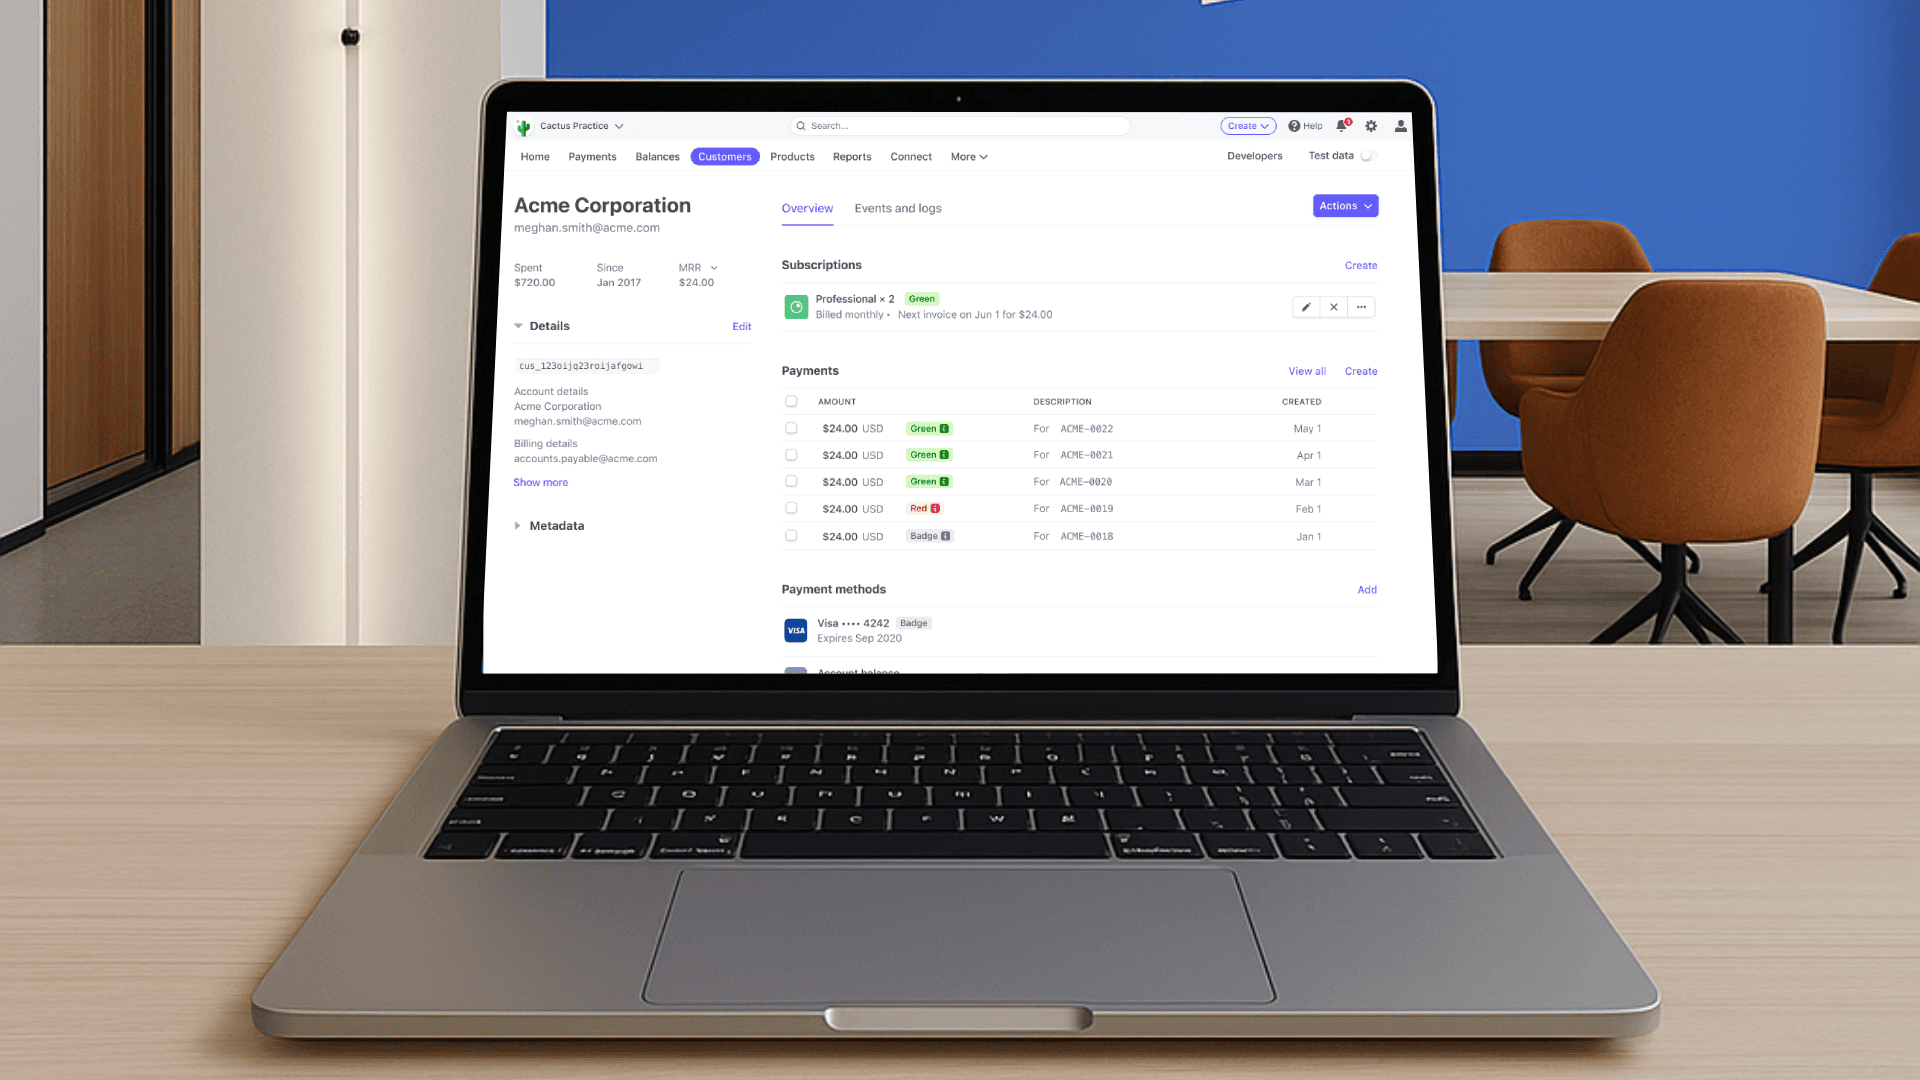
One of the most impactful outcomes was the creation of a real-time payout forecast feature. Previously, many users relied on spreadsheets or external communication (including messaging apps) to track transfers. Today, this functionality is fully integrated into the dashboard, allowing users to anticipate cash flow more accurately and operate with greater confidence.